|
Doc Brown's
Advanced Organic Chemistry - SPECTROSCOPY
PART 15.5
UV and Visible Spectroscopy - theoretical explanation
15.5.2
Examples of uv and visible absorption and reflectance spectra
[Author
©
Dr
WP Brown PhD: Doc
Brown's advanced level organic chemistry exam revision notes
suitable for students of UK A level chemistry courses & US K12 grade
11-12 & AP honors chemistry courses:
Theory of uv-visible
absorption
spectroscopy
[updated
Jan 3rd 2026]
Sub-index for this page
15.5.1
The origin of colour, the wavelengths of
visible light, our perception!
(separate page)
15.5.2
uv-visible spectroscopy
theory, spectrometer, absorption & reflectance spectra
explained (this page)
15.5.2
uv-visible spectroscopy
theory, spectrometer, absorption & reflectance spectra
explained (this page)
15.5.3
uv-visible absorption
spectra, examples index: uses, applications, more on colour chemistry
(separate page)
Sub-index for
section 15.5.2
(a)
The molecular absorption of uv and visible light
photons - formation of electronic spectra
(b)
How a
uv-visible light spectrometer works
(c)
More on absorption spectra
and their interpretation
(d)
Reflectance spectra
(e)
Examples and theory of coloured inorganic compounds
(f)
Examples
and theory of coloured organic compounds - chromophores
(g)
The
theory of flame emission and absorption spectroscopy
(separate page)
All my advanced A level organic chemistry notes
SPECTROSCOPY INDEXES
email doc
brown - query? comment?
*
[privacy policy, cookies
and disclaimer]
This is a BIG
website, PLEASE take time to explore it [ SEARCH
BOX]
15.5.2 (a) The molecular
absorption of uv and visible light photons - formation of electronic spectra
This section is all about how our perception of
'colours' is related to molecules when they absorb uv or visible
light photon.
When a molecule absorbs a
uv-visible photon, if it is of sufficient energy, an
electron can be promoted to a higher electronic quantum level
e.g. electronically, the molecule's electron is raised from a
ground state to an excited state (often denoted by
a *) and the molecule M is
then described as being 'excited'.
M === h ===> M*
This is shown
by
∆E (=
h)
on the diagram below, the energy change from the ground
state to the excited state.
An electron is promoted to a higher
energy level molecular orbital (no details required
pre-university!).
For absorption spectra, it is
the outer bonding and non-bonding electrons (lone pairs) that
are involved in the electronic quantum level changes.
The 'inner' electrons are
held too strongly by the positive nucleus to be promoted to
a higher level by uv-visible photons.

A very simple diagram illustrating two
possible electron level changes i.e. a lower energy
excitation from a visible light photon and from a ground
state to an excited state, and higher excitation energy
requirement from a uv photon.
An arrow pointing up means absorption of
a photon of energy.
An arrow pointing
down means releasing the energy absorbed as re-emitted
radiation or more complex changes resulting ultimately
increasing the translation kinetic energy of the
material i.e. an increase in temperature.
Unfortunately things are a bit more complicated
than the 'simple' ==
∆E
==> change indicated on the diagram.
In terms of absorption of EM radiation:
∆Euv
>
∆Evisible
>> ∆Evib
>>
∆Eir
>>
∆Etrans
i.e. higher electronic energy levels are only accessed
by higher energy ultraviolet photons and the substance
is colourless unless
∆E
is low enough to cause absorption of visible light
photons to produce a coloured material.
I've indicated the associated vibrational and rotational
levels for the uv ∆E, it is the same
for the
smaller ∆E visible light photon absorption (but
not shown). On some absorption spectra can
actually see some of the vibrational modes as finer
peaks on a broad absorption band. So, this situation
needs some extra explanation!
The
energy of a molecule in a particular state is the sum of the
electronic energy + vibrational energy + rotational energy
(and strictly speaking + translational kinetic energy
too).
For each electronic quantum level, there are
associated vibrational quantum levels of the bonds and for
each vibrational level there are associated rotational
quantum levels (for each of these there are associated
translation kinetic energy levels).
So for a given electronic energy level
change there are actually lots of other ΔE changes
possible.
The gaps between vibrational
levels are around 100 times smaller than electronic
energy levels and gaps between rotational levels are
about 100 times smaller than vibrational level.
This is why UV-visible absorption spectra tend
to show as one or more very broad absorption bands.
What does an absorption spectra look like?
The three spectra of aromatic compounds
and a transition metal ion below illustrate some of the above points.
Note in all cases the broad absorption
bands, you rarely see sharp peeks you see in infrared
spectra or NMR spectroscopy.
Absorption spectra are usually presented
on the y-axis as the intensity of absorption (in
various units) versus the wavelength (x-axis),
λ usually in
nm, but can be frequency too.

(1)
 Methylbenzene, a colourless liquid,
whose absorption spectrum is shown above. Methylbenzene, a colourless liquid,
whose absorption spectrum is shown above.
Methylbenzene is colourless because the
∆E values are too high for visible light photon to
effect excitation of an electron to a higher energy
level.
However, below 380 nm
(start of uv region), you do get absorption of uv
photons from 275 nm downwards - several broad peaks and
note the fine structure peaks from associated
vibration levels in the methylbenzene molecule.
There is a
λmax of 190 nm, these
λmax maximum absorbance wavelengths are characteristic of each
substance under investigation.
For more see
The
uv-visible absorption spectra of selected aromatic compounds - arenes


(2) 3-nitrophenol, pale yellow solid,
same colour in a solution, whose absorption spectrum is
shown above.
As well as in the uv region, 3-nitrophenol absorbs in the blue-violet light region (~380 - 500
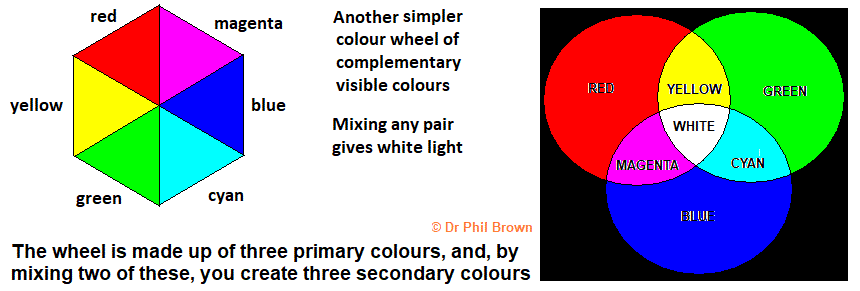
nm) of the visible spectrum - and is yellow in colour, the
complimentary of blue, see the simplified colour wheel
below.
Two of bands have peaks,
λmax
at 275 and a
λmax at 340 nm, but, although both peaks are in the 'invisible'
uv region, the right-hand absorption band extends well
into the violet-blue region of the visible spectrum.
Note that a different substituent
group in the benzene ring alters the energy levels of
the pi electrons, lowering them sufficiently to allow
excitation with lower energy uv photons.
For more see
The uv-visible absorption spectra
of some phenols

 (3) A typical
transition metal complex ion absorption spectrum - for the
pale purple hexaaquatitanium(III) ion shown above
(sometimes quoted as violet). (3) A typical
transition metal complex ion absorption spectrum - for the
pale purple hexaaquatitanium(III) ion shown above
(sometimes quoted as violet).
The
λmax ~520 nm, shows strong absorption in the blue-green-yellow region,
but little
absorption in the violet and red regions, resulting in the ion being purple
in aqueous solution from a combination of violet and red.
Note the strong
absorption in the 'invisible' ultraviolet region <380
nm).
Colour theory of
transition metal ions (this page section (e))
More examples transition metal ions (index of
examples)
Further
complications that broaden the absorption bands in uv or
visible absorption spectra
In a
solid, the main factors that cause broadening of the spectral
line into a broad absorption band are the distributions of
vibrational and rotational energies of the molecules in the
sample (and also those of their excited states) which are
'super-imposed' onto the electronic level changes - so there are
many possible quantum level changes.
In pure
liquids or solutions, the same situation occurs, but there is
now an extra broadening of the absorption band due to collisions
between the molecules - which is significant enough to cause
even more blurring together of the energy differences between
the different rotational and vibrational states, such that the
spectrum consists of broad absorption bands instead of discrete
lines. This means when we refer to a colour, we
are dealing with a band of frequencies, but wavelengths are usually quoted on the y axis of uv-visible
absorption spectra.
What happens to the energy
of absorbed uv-visible photons?
Molecules in an excited state are inherently in an
unstable condition and the electron returns to a lower
level, and, in doing so, the absorbed radiation is
re-emitted, but not at once - the radiation can be
re-emitted in stages via intermediate energy levels.
The relatively smaller amounts of higher vibrational
level energies are readily lost by molecular collisions,
so the molecule can drop to lower vibrational levels for
the same electronic level., this increases the
translational kinetic of the molecules, slightly
increasing the temperature of the material.
(b) How a uv-visible spectrometer works

A uv-visible absorption spectrometer works in a similar way
to an
infrared spectrometer.
The substance under investigation is usually dissolved in
a suitable solvent.
After passing through a diffraction grating that scans
through the uv-visible wavelength range, the beam of uv-visible light is split into two identical beams, one passes through a reference cell of the pure solvent and the
other through the solution of the material under investigation
(the reference beam and sample beam).
There must be no absorption by the solvent in the
wavelength region being investigated for a particular
material.
This is not usually a problem with a coloured
substance, because there are many colourless solvents that,
in terms of electronic quantum level changes, only begin to
absorb in the ultraviolet region of the spectrum <380 nm).
The solvent and solution are contained in cuvettes, usually of cross-section
1cm2, and made of high quality
'optical' standard pure silica glass to minimise interfering
absorbances.
The detectors are synchronised with the diffraction grating
to scan through the uv-visible bands and
measure the absorbance versus the wavelength of the light beam.
A = log10(Io / I0 )
= ɛcL
A = absorbance, Io = Intensity of reference beam, I =
intensity of sample beam, c = concentration, l = path length
ɛ = extinction coefficient, the absorption coefficient
for a particular compound at a particular wavelength
This is mathematical expression of the Beer-Lambert Law
which infers that the absorbance is proportional to
concentration - often valid for relatively low
concentrations.
A colorimeter is simple type of
visible light spectrometer (spectrophotometer)
and
measures intensity of absorption over a narrow range of
wavelengths governed by a filter - but it is a simple and
accurate method to measure concentration.
See
Colorimetric analysis
and determining a transition metal complex ion formula
AND note how a colorimeter works and the use of a linear calibration graph in colorimetric
analysis.
(c)
More on absorption spectra and
their interpretation
First study the
Three spectra were looked
at in section (c) (opened in new window for
convenience)
Interpreting a uv-visible spectrum (with particular
reference to colour chemistry)
There are three main features a spectrum
(i) The wavelengths of the uv-visible wavelengths
absorbed (or reflected),
λ
usually shown in nanometres (nm).
The wavelength of absorption depends on the values of
the electronic quantum levels.
(ii) The intensity of the absorption, particularly the
characteristic
λmax
peaks in the uv-visible spectrum.
The
λmax
peaks are important for quantitative analysis, giving
the maximum sensitivity possible.
(iii) The shape of absorption bands across the region
where absorption takes place, see point (iii) below.
All three characteristics are dependent on the
structure of the organic/inorganic molecule or ion.
More on aspects of molecular structure and absorption
wavelength and intensity
(i) For organic molecules with delocalised electron systems, the
longer the conjugated carbon chain, the more intense is the
absorption and the longer the correspond
λmax.
For example see the difference
between the absorption spectra of buta-1,3-diene
(colourless) and carotene (orange), the deriving from
multiple conjugated C=C double bonds.
(ii) The intensity of absorption also
depends on concentration of the solution of the compound
under investigation or analysis.
(iii) Colour chemists are very interested in
not just the absorption spectra and resulting colour, but
how intense is the colour for commercial dyes for fabrics -
the latter affects the quantity of the organic molecule
needed.
The shape and width of the
absorption band/bands controls the shade and
purity-quality of the colour observed - you can even do
reflectance spectra of
a dye absorbed on a fabric to compare it with its
solution..
(d)
Reflectance spectra
Absorption spectra of coloured compounds are obtained using a
solution of the in a colourless-transparent solvent.
However, if the material is an insoluble or is being
investigated as part of a surface e.g. a forensic examination of
a valuable painting, then a different technique is used to
obtain a reflectance spectrum.
In this technique white light is shone onto the surface of the solid (pigment powder or painting surface)
and the reflected light analysed in a reflectance
spectrometer.
Here you are analysing the light wavelengths reflected, NOT
the light wavelengths absorbed.
A reminder diagram to show the origin of the blue colour of a
molecule in terms of transmission light through its blue
solution and reflectance from the surface of the solid.

If the molecule absorbs in the yellow (or green-red) it
appears violet-blue (the complimentary colour).
See
methylene blue on the
page of aromatic uv-visible spectra
We can now compare the difference between the absorption
spectrum and the reflectance spectrum for the same blue pigment
(or dye) described above.

The bulk absorption, mainly in the red-orange visible light
region, and not in the blue-green region, produces a blue
solution absorption spectrum.
The reflected wavelengths, mainly in the visible light blue
region, and surface absorption of the red-orange region,
produces a blue solid reflectance spectrum.
(e)
Examples and theory of some coloured inorganic compounds
(i) Transition metal complexes
(confined to the 3d block)

Many compounds of transition metals e.g. complex
ions, are coloured inferring the
∆E for
electronic changes involving the central metal ion can be caused
by photons in the visible region of light.
The ligands in transition
metal complexes cause a splitting of the d orbitals in the d
sub-shell (see diagram below).
The observed colour resulting
from the ∆Eelec changes due to the 3d (or any
d) orbital splitting depend on:
(i) the d electron
configuration of the central metal ion and its oxidation
state - the electronic state of the d orbital sub-shell,
(ii) the nature of the
ligand and strength of its bond with the central metal ion -
different ligands have different effects on the relative
energies of the d orbitals of a particular ion.
(iii) the number and
spatial arrangement of the ligands - this affects the
splitting of the d sub-shell.
This can be illustrated by a
simple reduction experiment using a soluble vanadium(V) and
reducing it with zinc and dilute sulfuric acid. A series of
vanadium ions of ever decreasing oxidation state are formed and
all have a different colour.
Vanadium V(+5, yellow) ==> V(+4, blue) ==>
V(+3, green) ==> V(+2, violet)
For full details of these chemical reactions see the
chemistry of vanadium
The colours originate from the splitting of the 3d orbitals under the influence
of the ligands - illustrated above.
For octahedral complexes the split is 3 lower and 2 higher 3d orbitals and all
the diagrams refer to [M(H2O)6]n+.
As a result, an electron can be excited-promoted from a lower 3d orbital to a
higher.
In the left diagrams above (1) and (4) represent situations where an electronic
excitation to produce colour cannot happen because either, there is no electron
available for excitation (1), or there is no available orbital to accept an
excited electron (4).
In the case of (2) and (3) it is possible to excite an electron from a lower 3d
level (top-left diagram) to a higher 3d level (bottom-left diagram).
The right-hand diagram shows the colours and electron configurations of various
hexaaqua 3d block transition metal ions.
For more details see
Electron configuration
of transition metal ions and colour theory
and for examples of transition ion absorption spectra see
08
The
uv-visible absorption spectra of some copper complex ions
01
The
uv-visible absorption spectra of some cobalt complex ions
05
The uv-visible absorption spectra
of selected titanium complex ions
12
The uv-visible absorption spectra
of selected nickel complex ions
13
The uv-visible absorption spectra
of selected manganese complex ions
06
The uv-visible absorption spectra of
some chromium ions
(ii) Absorption
spectra of the halogen molecules (separate page)
(f)
Examples and theory of some coloured organic compounds -
chromophores
Many coloured organic compounds contain unsaturated groups:
e.g. C=C
(alkene),
 (aromatic),
C=O
(carbonyl), -N=N- (azo linkage)
(aromatic),
C=O
(carbonyl), -N=N- (azo linkage)
When these groups form part of an extended delocalised
electron system (conjugated) the
electronic energy levels can be low enough for photons of
visible light to be absorbed and electrons promoted to a higher
level - giving the molecule its colour.
Electrons in double bond systems (π orbitals) are more
spread out than single bonds (σ bonds),
and, dispersion of charge lowers the potential energy, so
these 'pi' electrons require less energy to be excited to a
higher level i.e. visible light photons.
However, if lone pairs of electrons can interact with the
pi bond systems, they are effectively become part of the
chromophore and modify its colour effect, particularly if
attached to a benzene ring.
e.g. the functional groups -OH,
-NH2,
-NR2
(R = alkyl),
where the N or O atom has 1 or 2 lone pairs of electrons,
all of which are known interact with pi electron clouds if
they are directly attached to a benzene ring.
Also groups such as -NO2 or -SO3- extend
the delocalised system of the benzene ring and hence
change the absorption spectra and the colour of the
compound.
Small changes in the energy of the delocalised pi
electrons affects the
∆Evis
needed for excitation and so affects absorption and the
resulting colour of the compound.
The part of the molecule, including the extended delocalised
electron system, that allows visible light absorption, hence
colour, is called the
chromophore.
BUT, note that some small parts of the molecule might be
described as the chromophore e.g. the -N=N- azo group, so
take care when having to describe the chromophore in a given
molecule.
(i) Example of an alkene chromophore

The beta-carotene molecule is an orange organic
pigment found in carrots
Note that the 'monomer' Z-2-methylbuta-1,3-diene
(isoprene, shown on the right), with a much shorter delocalised electron system,
from which beta-carotene is biosynthesised, is colourless.
The extended conjugated alternate C-C single
and C=C double bond system becomes the chromophore,
sufficiently low in energy to allow pi electron excitation
by visible light photons to give an orange colour.
For more details see
The
absorption spectra of alkenes
(ii) Examples of dyes
e.g the azo dye chromophore
The diagram below illustrates absorption
spectra of three dyes with different visible light
absorption bands, giving rise to three different colours.

Dye A absorbs in the blue and will look
yellow,
λmax 410 nm.
Dye B absorbs in the blue-green-yellow and will
look red-purple?,
λmax 510 nm
Dye C absorbs in the yellow-orange, will
look blue-cyan,
λmax 590 nm
A series of dyes often contain the same
chromophore e.g.
C6H5-N=N-C6H4
 is orange,
 is
yellow
is
yellow
For more details of absorption spectra of
dyes and natural pigments see:
02
The
uv-visible absorption spectra of alkenes
03
The uv-visible absorption
spectrum of chlorophyll, photosynthesis
(porphyrin pigment)
04
The uv-visible absorption spectra
of the photopigments in the human eye
11
The uv-visible absorption spectra
of some azo dyes
11
The uv-visible absorption spectrum of
methylene blue
16
The uv-visible absorption
spectrum of haemoglobin
(porphyrin pigment)
17
The uv-visible
absorption spectrum of melanin pigments

SPECTROSCOPY INDEXES
All Advanced Organic
Chemistry Notes
[WEBSITE SEARCH
BOX]
Index of my advanced
(pre-university) organic
chemistry revision notes
The chemistry of
alkanes and the petrochemical
industry
The
chemistry of alkenes
The
chemistry of haloalkanes
The
chemistry of
alcohols
The chemistry of aldehydes
and ketones
The
chemistry of carboxylic acids and derivatives
The chemistry of organo-nitrogen compounds
The chemistry of
aromatic compounds
|
Website content © Dr Phil Brown 2000+.
All copyrights reserved on revision notes, images, quizzes,
worksheets etc. Copying of website material is NOT permitted. Exam
revision summaries & references to science course specifications are
unofficial.
Website content © Dr Phil Brown 2000+. All
copyrights reserved on these organic chemistry exam revision
notes on theory of uv-visible absorption spectroscopy, these A level
chemistry revision notes are suitable for use of pre-university students studying AQA advanced level
organic chemistry revision notes on theory of uv-visible absorption
spectroscopy, Edexcel advanced level
organic chemistry revision notes on theory of uv-visible absorption
spectroscopy, OCR advanced level
organic chemistry revision notes on theory of uv-visible absorption
spectroscopy, IB advanced level
organic chemistry revision notes on theory of uv-visible absorption
spectroscopy, WJEC (Eduqas) advanced level
organic chemistry revision notes on theory of uv-visible absorption
spectroscopy, CIE Cambridge advanced level
organic chemistry revision notes on theory of uv-visible absorption
spectroscopy, CCEA advanced level
organic chemistry revision notes on theory of uv-visible absorption
spectroscopy, and useful for US grade 11 grade 12 AP honors
organic chemistry courses involving theory of uv-visible absorption
spectroscopy |
|


 ENTER
chemistry words e.g. topic, module, exam board,
formula, compound, reaction, structure, concept, equation, any 'phrase',
homework question! anything of chemical interest, like your latest homework question!
or anything
of scientific interest! This is a very comprehensive Google
generated search of my website.
ENTER
chemistry words e.g. topic, module, exam board,
formula, compound, reaction, structure, concept, equation, any 'phrase',
homework question! anything of chemical interest, like your latest homework question!
or anything
of scientific interest! This is a very comprehensive Google
generated search of my website.