|
GCSE level Physics exam revision notes
Thermal energy & particle theory: 4.5
Heating/cooling
curves -
steadily increasing/decreasing the internal energy of a system to cause state changes
and relating
latent heat energy to the state changes of melting/boiling and
condensing/freezing
4.5 The
heating curve of state changes, latent heat and particle theory
4.6 The cooling curve of state changes,
latent heat and particle theory
KEY POINTS:
Latent heat & particle models - describing and explaining heating and
cooling curves
[Author
©
Dr Phil Brown PhD:
Doc Brown's physics exam revision notes suitable for students of UK
IGCSE & GCSE level physics courses, ~ US grades 9-10 physics
[heat-4- page updated June 30th 2026 **]
email doc
brown: problems?, comments? query?
*
[privacy & cookies policies & disclaimer]
[ KEY
POINTS and learning objectives for this page, after initial notes]
INDEX for my physics notes on particle model theory
explaining
state changes, latent heat, heating and cooling curves
4.5
Thermal energy & particle theory:
A heating Curve
- steadily increasing the internal energy of a system to cause state changes
-
melting and boiling
-
See also 4.6 cooling curve
-
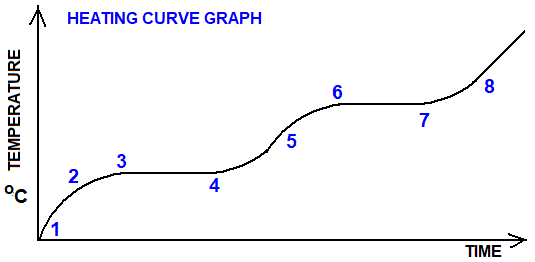
When a solid is heated from the solid
state to the gaseous state and the temperature of the system measured
continuously, there are two horizontal sections on the graph where the
temperature does not rise, despite the constant input of thermal energy
(continuous heating).
-
Typical results are shown in the heating curve
graph below.
-
 This
is called a HEATING CURVE This
is called a HEATING CURVE
-
On heating the substance,
initially the temperature of the solid increases as the thermal energy
added increases the kinetic energy (KE) of vibration of atoms in the
solid.
-
When you
reach the melting point Tm, the graph becomes horizontal as the
temperature remains constant.
-
After all the substance
has melted, the temperature begins to rise again, increasing the thermal
energy store as the KE of the now freely moving particles increases, but
not the potential energy store.
-
When the temperature
reaches the boiling point Tb, its stays constant until all the liquid
has boiled to the gaseous state, and this is increasing the internal
energy store including the potential energy store, but not the thermal
energy store.
-
As you heat the substance you are increasing the internal energy. BUT the temperature stays constant during the state changes of melting
at temperature Tm and boiling at temperature Tb (see diagram above).
-
This is because all the extra ('hidden')
energy absorbed in heating at these two temperatures (called the latent
heat of state change), goes into weakening the inter–particle forces
(intermolecular bonds) sufficiently to change a solid to a liquid at
Tm and a liquid to
a gas at Tb, observed as horizontal sections (plateau) on the graph.
-
This
thermal energy input induces the state change without temperature rise,
to cause melting and then boiling to take place.
-
The thermal energy gain at this point equals the
heat energy
absorbed needed to
reduce the interparticle forces in melting or boiling - the latent heat
of fusion (melting) and latent heat of vaporisation (evaporation, boiling).
-
During the state change the temperature stays
constant until all the latent heat is absorbed and the state change
completed, so no temperature rise can occur.
-
In between the 'horizontal' state change
sections of the graph, you can see the energy input increases the
kinetic energy of the particles and raising the temperature of the
substance as you expect as the internal energy increases.
-
For these state changes you have the addition of the
latent heat of melting at temperature Tm and the addition of the
latent heat of boiling at temperature Tb.
-
The diagram involving the
brown half-arrows
illustrates what is happening to the energy stores in a heating curve.
-
The
heating curve is all about increasing the thermal energy store of a
substance and the latent heat complications!
brown half-arrows left to
right
-
Remember:
internal energy = total KE of particles (thermal energy store) +
potential energy of particles

The latent heat for the state changes solid <=> liquid
is called the specific latent heat of fusion (for melting or freezing).
The latent heat for the state changes liquid <=> gas is
called the specific latent heat of vaporisation (for condensing,
evaporation or boiling)
For more on latent heat see my physics notes on
specific latent heat
Note that not all the terms
used to describe latent heat energy changes fitted on the diagram, so note:
(i) The latent heat of
fusion/melting = latent heat of freezing/solidifying
(ii) The latent heat of
boiling/evaporation/vaporisation = latent heat of condensation
A simple
experiment to illustrate a 'heating curve'
-
You start with a beaker of crushed
ice into which you place a thermometer (-10 to 110oC
thermometer).
-
Place on a tripod and gauze and
record the temperature at the start.
-
To speed things up, heat the beaker
of ice steadily with a Bunsen flame.
-
Continue to record the temperature
every minute until all the ice has melted and eventually the water will
boil.
-
Finish taking temperature readings
after 5 minutes of boiling.
-
Plot a graph of temperature versus
time.
-
It should look like the graph above,
apart from the initial rise of temperature of solid ice.
-
You should get
two horizontal
sections on the graph where the latent heat of fusion (melting at 0oC)
or the latent heat of boiling (vaporising at 100oC) are
being absorbed to weaken the intermolecular forces between the water
molecules, without rise in temperature.

General heating curve for the melting and boiling of a substance

The heating curve for
melting ice and boiling water which you can determine in a simple
laboratory experiment.
For water the horizontal line
temperatures are melting point 0oC and boiling point 100oC
It is difficult to get temperature
readings of (e.g. -18oC) ice from the freezer, which is why
the graphs starts at the melting point of ice. and no preliminary curve
upwards is shown.
Similarly, in the context of school
experiments, it is difficult to get readings of the very hot steam above 100oC.
INDEX of notes on Particle model theory
state changes and latent heat
|
Thermal energy & particle theory: 4.6
A cooling curve
- steadily decreasing internal energy of a system to cause state changes
- condensing and freezing
See also
4.5 The heating curve of state changes
4.6
A cooling Curve
- steadily decreasing the internal energy of a system
-
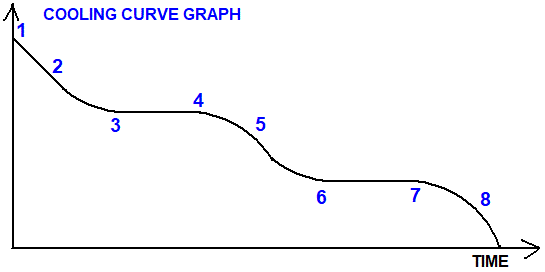
As you cool a substance you are decreasing the internal energy. BUT the temperature stays constant during the state changes of
condensing
at temperature Tc and freezing at temperature Tf (see diagram below).
-
Similarly when a gas is cooled from
the gaseous state to the solid state and the temperature of the system
measured continuously, there are two horizontal sections on the graph
where the temperature does not fall, despite the constant removal of
heat energy (continuous cooling). Typical results are shown in the cooling curve graph below.
-
 This
is called a COOLING CURVE This
is called a COOLING CURVE
-
As you cool the
gaseous substance you are decreasing the internal energy as the KE is
reducing, but not the potential energy.
-
When the
substance is cooled to the condensation temperature Tc, the temperature stays constant during the state changes of condensing
(gas ==> liquid) at temperature Tc (similarly at freezing/solidifying at temperature Tf).
-
This is because all the extra
('hidden') heat energy removed on cooling at these temperatures (the
latent heat of state change),
allows the
strengthening of the inter–particle forces without temperature fall to
allow condensation and then freezing to take place.
-
After Tc, when all is
condensed, the temperature falls as the KE of the particles falls, until Tf
when the liquid starts to freeze (solidify).
-
When all the liquid has
solidified, the temperature falls as the KE of the particles decreases,
continuing to decrease the thermal energy store as part of the decrease in
internal energy.
-
On cooling, the heat energy loss
at the horizontal sections Tc and Tf, is compensated by the increased intermolecular force
attraction which releases heat energy of the state changes - the latent
heat of fusion.
-
During the state change the temperature stays
constant until all the latent heat is removed and the state change
completed, so no temperature fall can occur.
-
In between the 'horizontal' state change sections of the
graph, you can see the energy 'removal' reduces the kinetic energy of
the particles, lowering the temperature of the substance.
-
For these state changes you have the removal of the
latent heat of vaporisation (condensation) at temperature Tc and the removal of
the latent heat of fusion (freezing) at temperature Tf.
-
The diagram involving the
blue half-arrows
illustrates what is happening to the energy stores in a cooling curve.
-
The
cooling curve is all about decreasing the thermal energy store of a
substance and the latent heat complications!
blue half-arrows from right to
left
-
Remember:
internal energy = total KE of particles (thermal energy store) +
potential energy of particles
Note that not all the terms used
to describe latent heat energy changes fitted on the diagram, so note:
(i) The latent heat of
fusion/melting = latent heat of freezing/solidifying
(ii) The latent heat of
boiling/evaporation/vaporisation = latent heat of condensation
A simple
experiment to illustrate a 'cooling curve'
-
Its not so easy to do a cooling curve
by reversing the experiment described above for a 'heating curve'
because in the context of school experiments you can't start with hot
vapour!
-
However, you can do a 'partial'
cooling curve experiment using a low melting solid like stearic acid.
-
You start with boiling tube with a
few cm depth of stearic acid in it plus a 0 to 100oC
thermometer.
-
Place the boiling tube in hot water
until all the 'waxy' stearic acid melts.
-
Keep on heating it until the
temperature reads at least 80oC.
-
Remove the boiling tube and record
the temperature of the melted acid.
-
Allow the tube of melted acid to cool
on its own and record the temperature every minute until all of the acid
has gone solid AND keep on recording for at least another 5 minutes.
-
Plot a graph of temperature versus
time and it should look like the right-hand sections of the graph above.
-
In the middle of the graph should be
a horizontal section corresponding to the transfer of the latent heat of
fusion to the surroundings at the freezing point - to enable the kinetic
energy of the molecules to fall sufficiently for the intermolecular
forces to increase and cause solidification (crystallisation of the
stearic acid molecules).
-
Your graph should look something like
the right-hand section of the graph above and the graph below.
-
The temperature of the horizontal
section is the freezing/melting point, and is 80oC for
stearic acid.
INDEX of notes on Particle model theory
state changes and latent heat
How a refrigerator works
In a refrigeration the refrigerant gas is compressed to a
liquid and the latent heat is released and transferred through heat
exchanger tubes/fins at the back of the fridge.
The compressed liquid is pumped around in copper tubing in
the inner panelling of the refrigerator where it evaporates, absorbing the
latent heat of evaporation.
This completes the cycle of removing thermal (heat) energy
from inside the refrigerator to the outside air - that's why you can feel
warm air at the back of a refrigerator.
|
Key points
Thermal energy & particle models - describing and explaining heating and
cooling curves
Information
sources for Doc Brown's key points: IGCSE-GCSE physics are based on
textbooks & syllabus-specifications for students taking the UK AQA, Edexcel,
OCR 21st Century Science, OCR Gateway science suite, WJEC, CCEA and CIE GCSE
physics 9-1 level science examinations
A structured and
exam-board-inclusive set of summary revision notes on
Heating and Cooling Curves, explained through latent heat,
particle theory, internal
energy, and thermal energy stores - tailored
for GCSE/IGCSE Physics students across WJEC,
CCEA, CIE, AQA, Edexcel, and OCR.
Heating and Cooling Curves: What They Show
- Graphs of temperature versus
time during heating or cooling.
- Reveal state changes
and energy transfers.
- Flat sections
= change of state (temperature constant).
- Sloped sections
= temperature change (kinetic energy increases or
decreases).
GCSE physics students need to be able to
describe what is going on at every stage and relate each one to the kinetic
particle theory of matter and latent heat of changes in state solid <=>
liquid <=> gas/vapour
Particle Theory
and Energy Stores
| Section of Curve |
Particle Behaviour |
Energy Transfer |
Store Affected |
| Sloped (e.g. solid heating) |
Particles vibrate faster |
Energy increases kinetic energy |
Thermal energy store |
| Flat (e.g. melting) |
Bonds break/form |
Energy changes potential energy |
Internal energy store |
| Sloped (e.g. liquid heating) |
Particles move faster |
Energy increases kinetic energy |
Thermal energy store |
| Flat (e.g. boiling) |
Particles escape liquid |
Energy breaks intermolecular
forces |
Internal energy store |
- Internal energy
= total kinetic + potential energy of particles.
- Thermal energy store
= part of internal energy due to particle motion.
Latent Heat & State Changes
Specific Latent Heat
- Energy needed to change state
of 1 kg of substance without temperature change.
- Formula:
Q = mL
- Q = energy (J)
- m = mass (kg)
- L = specific latent heat (J/kg)
Types of latent heat e.g.
| Type |
State Change |
Example |
| Fusion |
Solid ↔ Liquid |
Melting ice |
| Vaporisation |
Liquid ↔ Gas |
Boiling water |
See Part 4.7
Everyday examples
of latent heat internal energy transfers,
defining specific latent heat, examples of worked-out calculations involving specific latent heat
Required Knowledge by Exam Board
- Interpretation of heating/cooling
curves.
- Understanding of latent heat,
internal energy, and particle theory.
- Ability to explain flat
sections using energy stores.
Required Practicals (varies slightly by
board)
- Heating ice and recording temperature
over time.
- Identifying melting and
boiling points from graphs.
- Calculating energy transferred
during state changes.
Exam Tips about latent heat, state changes
and particle theory
- Flat sections
= energy used to change state, not temperature.
- Sloped sections
= temperature changes due to kinetic energy increase.
- Know the difference
between latent heat and specific heat capacity.
- Label graphs with states,
energy transfers, and particle behaviour.
Common Misconceptions about latent heat,
state changes and particle theory
- Temperature rises during
melting/boiling → It stays constant.
- Latent heat causes temperature change
→ It causes state change.
- Particles expand when heated →
They move faster, not grow.
- No energy transfer during flat
sections → Energy is transferred, just not as
temperature.
Keywords, phrases and learning objectives for particle models and a heating
curve
Be able to describe, draw and explain a g raph of a heating curve.
Know that heating a substance increases the internal energy of system,
eventually causing the state
changes of melting and boiling when the latent heat is absorbed.
Be able to draw, describe and explain the graph of a cooling curve
as the temperature of material is steadily lowered.
Know that this is decreasing the internal energy of
system, eventually causing the state changes of condensing, freezing,
as latent heat released and removed from the system.
Website content © Dr Phil Brown
2000+. All copyrights reserved on Doc Brown's physics revision notes,
images, quizzes, worksheets etc. Copying of website material is NOT
permitted. Exam revision summaries and references to science course
specifications are unofficial. Explaining the importance of describing
explaining heating and cooling curves and latent heat energy of state
change
in GCSE physics, What you need to know about describing explaining
heating and cooling curves and latent heat energy of state change for IGCSE
physics,
Explaining the use of describing explaining heating and cooling curves
and latent heat energy of state change knowledge in GCSE physics, Examples of
describing explaining heating and cooling curves and latent heat energy
of state change explained
for GCSE physics exams, What is
the significance of describing explaining heating and cooling curves and
latent heat energy of state change in studying for physics exams, What is the use of
describing explaining heating and cooling curves and latent heat energy
of state change ? Describing and
explaining the theory of describing explaining heating and cooling
curves and latent heat energy of state change, revision preparation for AQA GCSE
physics,
Edexcel GCSE physics, OCR GCSE physics. Website content © Dr
Phil Brown 2000+. All copyrights reserved on Doc Brown's physics revision notes, images,
quizzes, worksheets etc. Copying of website material is NOT
permitted. Exam revision summaries and references to science course specifications
are unofficial. These revision notes on describing
explaining heating and cooling curves and latent heat energy of state
change are suitable for AQA gcse physics,
describing explaining heating and cooling curves and latent heat energy
of state change revision notes for Edexcel gcse physics, describing
explaining heating and cooling curves and latent heat energy of state
change revision notes for OCR gcse Gateway science physics,
describing explaining heating and cooling curves and latent heat energy
of state change revision notes for OCR 21st Century
science physics, describing explaining heating and cooling curves
and latent heat energy of state change revision notes WJEC GCSE physics,
describing explaining heating and cooling curves and latent heat energy
of state change revision
notes for CCEA gcse physics, describing explaining heating and cooling
curves and latent heat energy of state change revision notes for CIE Cambridge IGCSE
physics exams. describing explaining heating and cooling curves
and latent heat energy of state change explained with examples, help in
revising describing explaining heating and cooling curves and latent
heat energy of state change for gcse physics exams, knowing the
importance of describing explaining heating and cooling curves and
latent heat energy of state change for gcse physics exams, key points to
know about describing explaining heating and cooling curves and latent
heat energy of state change, exam revision notes for describing
explaining heating and cooling curves and latent heat energy of state
change, what you need to know about describing explaining heating and
cooling curves and latent heat energy of state change, revision help in
learning about describing explaining heating and cooling curves and
latent heat energy of state change, Revision notes on xyz based on the syllabus-specifications
for students taking IGCSE/GCSE level physics examinations, summary
revision notes and key points on xyz for students taking the AQA
igcse/gcse physics notes on xyz, Edexcel gcse
physics notes on xyz, OCR 21st century GCSE
physics notes on xyz, OCR gateway
GCSE physics notes on xyz, WJEC gcse physics notes on xyz, CCEA
gcse physics notes on xyz for students taking CIE Cambridge igcse
physics, exam revision notes on
xyz, useful for US grade 9-10 physics courses,
importance of latent heat cooling &
heating curves
in GCSE level physics, What you need to know about latent heat cooling &
heating curves for
GCSE level
physics,
Explaining the use of latent heat cooling & heating curves knowledge in GCSE level physics, Examples of
latent heat cooling & heating curves explained
when studying GCSE level physics, What is
significant about latent heat cooling & heating curves, describing the theory of
latent heat cooling & heating curves when studying
GCSE level physics, revision notes for latent heat cooling & heating
curves in exams, online exam help
for latent heat cooling & heating curves, revision notes about latent
heat cooling & heating curves, what do I need to learn about latent heat
cooling & heating curves for
by GCSE physics exam?
help to understand the latent heat cooling & heating curves topic in preparation for GCSE physics exam
question, how to
prepare for questions involving latent heat cooling & heating curves in a GCSE physics examination?
|

